




Track performance, trends, satisfaction, and team activity across every support channel.
Trusted by 125+ companies


See performance across chat, tickets, agents, and your knowledge base in one place.
Monitor volume, satisfaction, and workload trends as they evolve throughout the day.
Understand how quickly your team responds, resolves issues, and handles customer demand.

Track availability, productivity, and contribution for every agent on your team.
Identify satisfaction patterns, recurring issues, and the topics customers search for most.
Spot emerging themes and high‑frequency problems through tag‑based reporting.

See which topics are well‑served and where content gaps may be impacting customers.
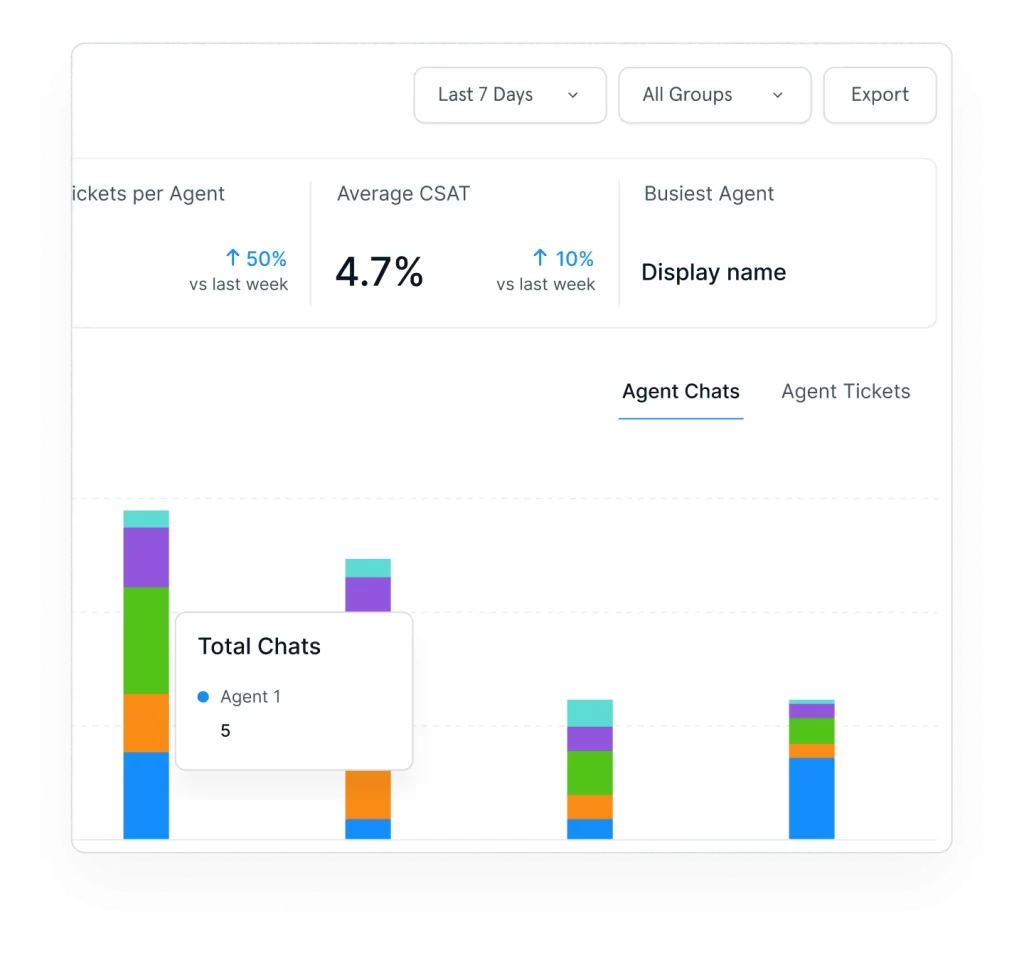
Drill into specific teams, time periods, or workloads with simple, intuitive filters.

Download any report instantly for deeper analysis or sharing with your team.
See performance across chat, tickets, agents, and your knowledge base in one place.

Monitor volume, satisfaction, and workload trends as they evolve throughout the day.

Understand how quickly your team responds, resolves issues, and handles customer demand.

Track availability, productivity, and contribution for every agent on your team.

Identify satisfaction patterns, recurring issues, and the topics customers search for most.

Spot emerging themes and high‑frequency problems through tag‑based reporting.

See which topics are well‑served and where content gaps may be impacting customers.

Drill into specific teams, time periods, or workloads with simple, intuitive filters.

Download any report instantly for deeper analysis or sharing with your team.
The overview dashboard brings together visitor traffic, chat and ticket volume, CSAT, and active agents, giving managers a quick snapshot of the contact center’s current state.
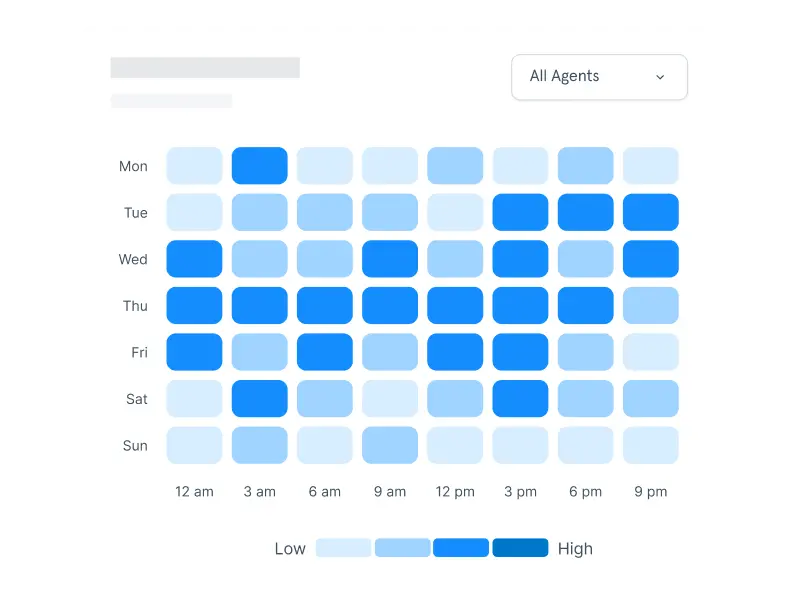
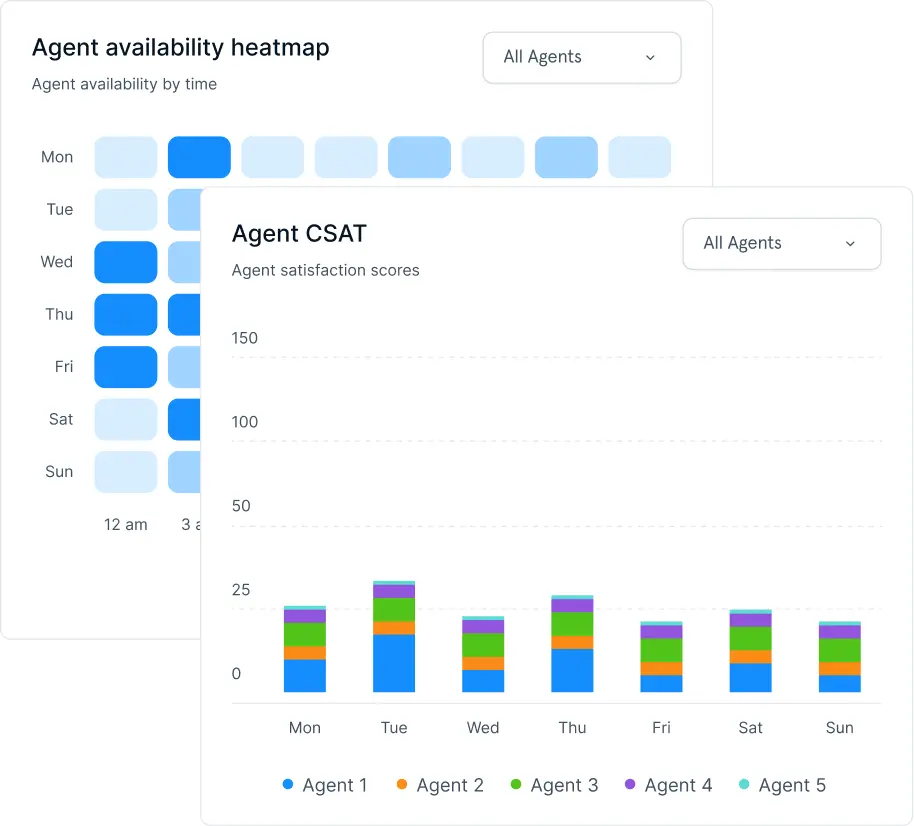
The heatmap highlights peak times across days and hours, helping teams anticipate demand and plan staffing more effectively.
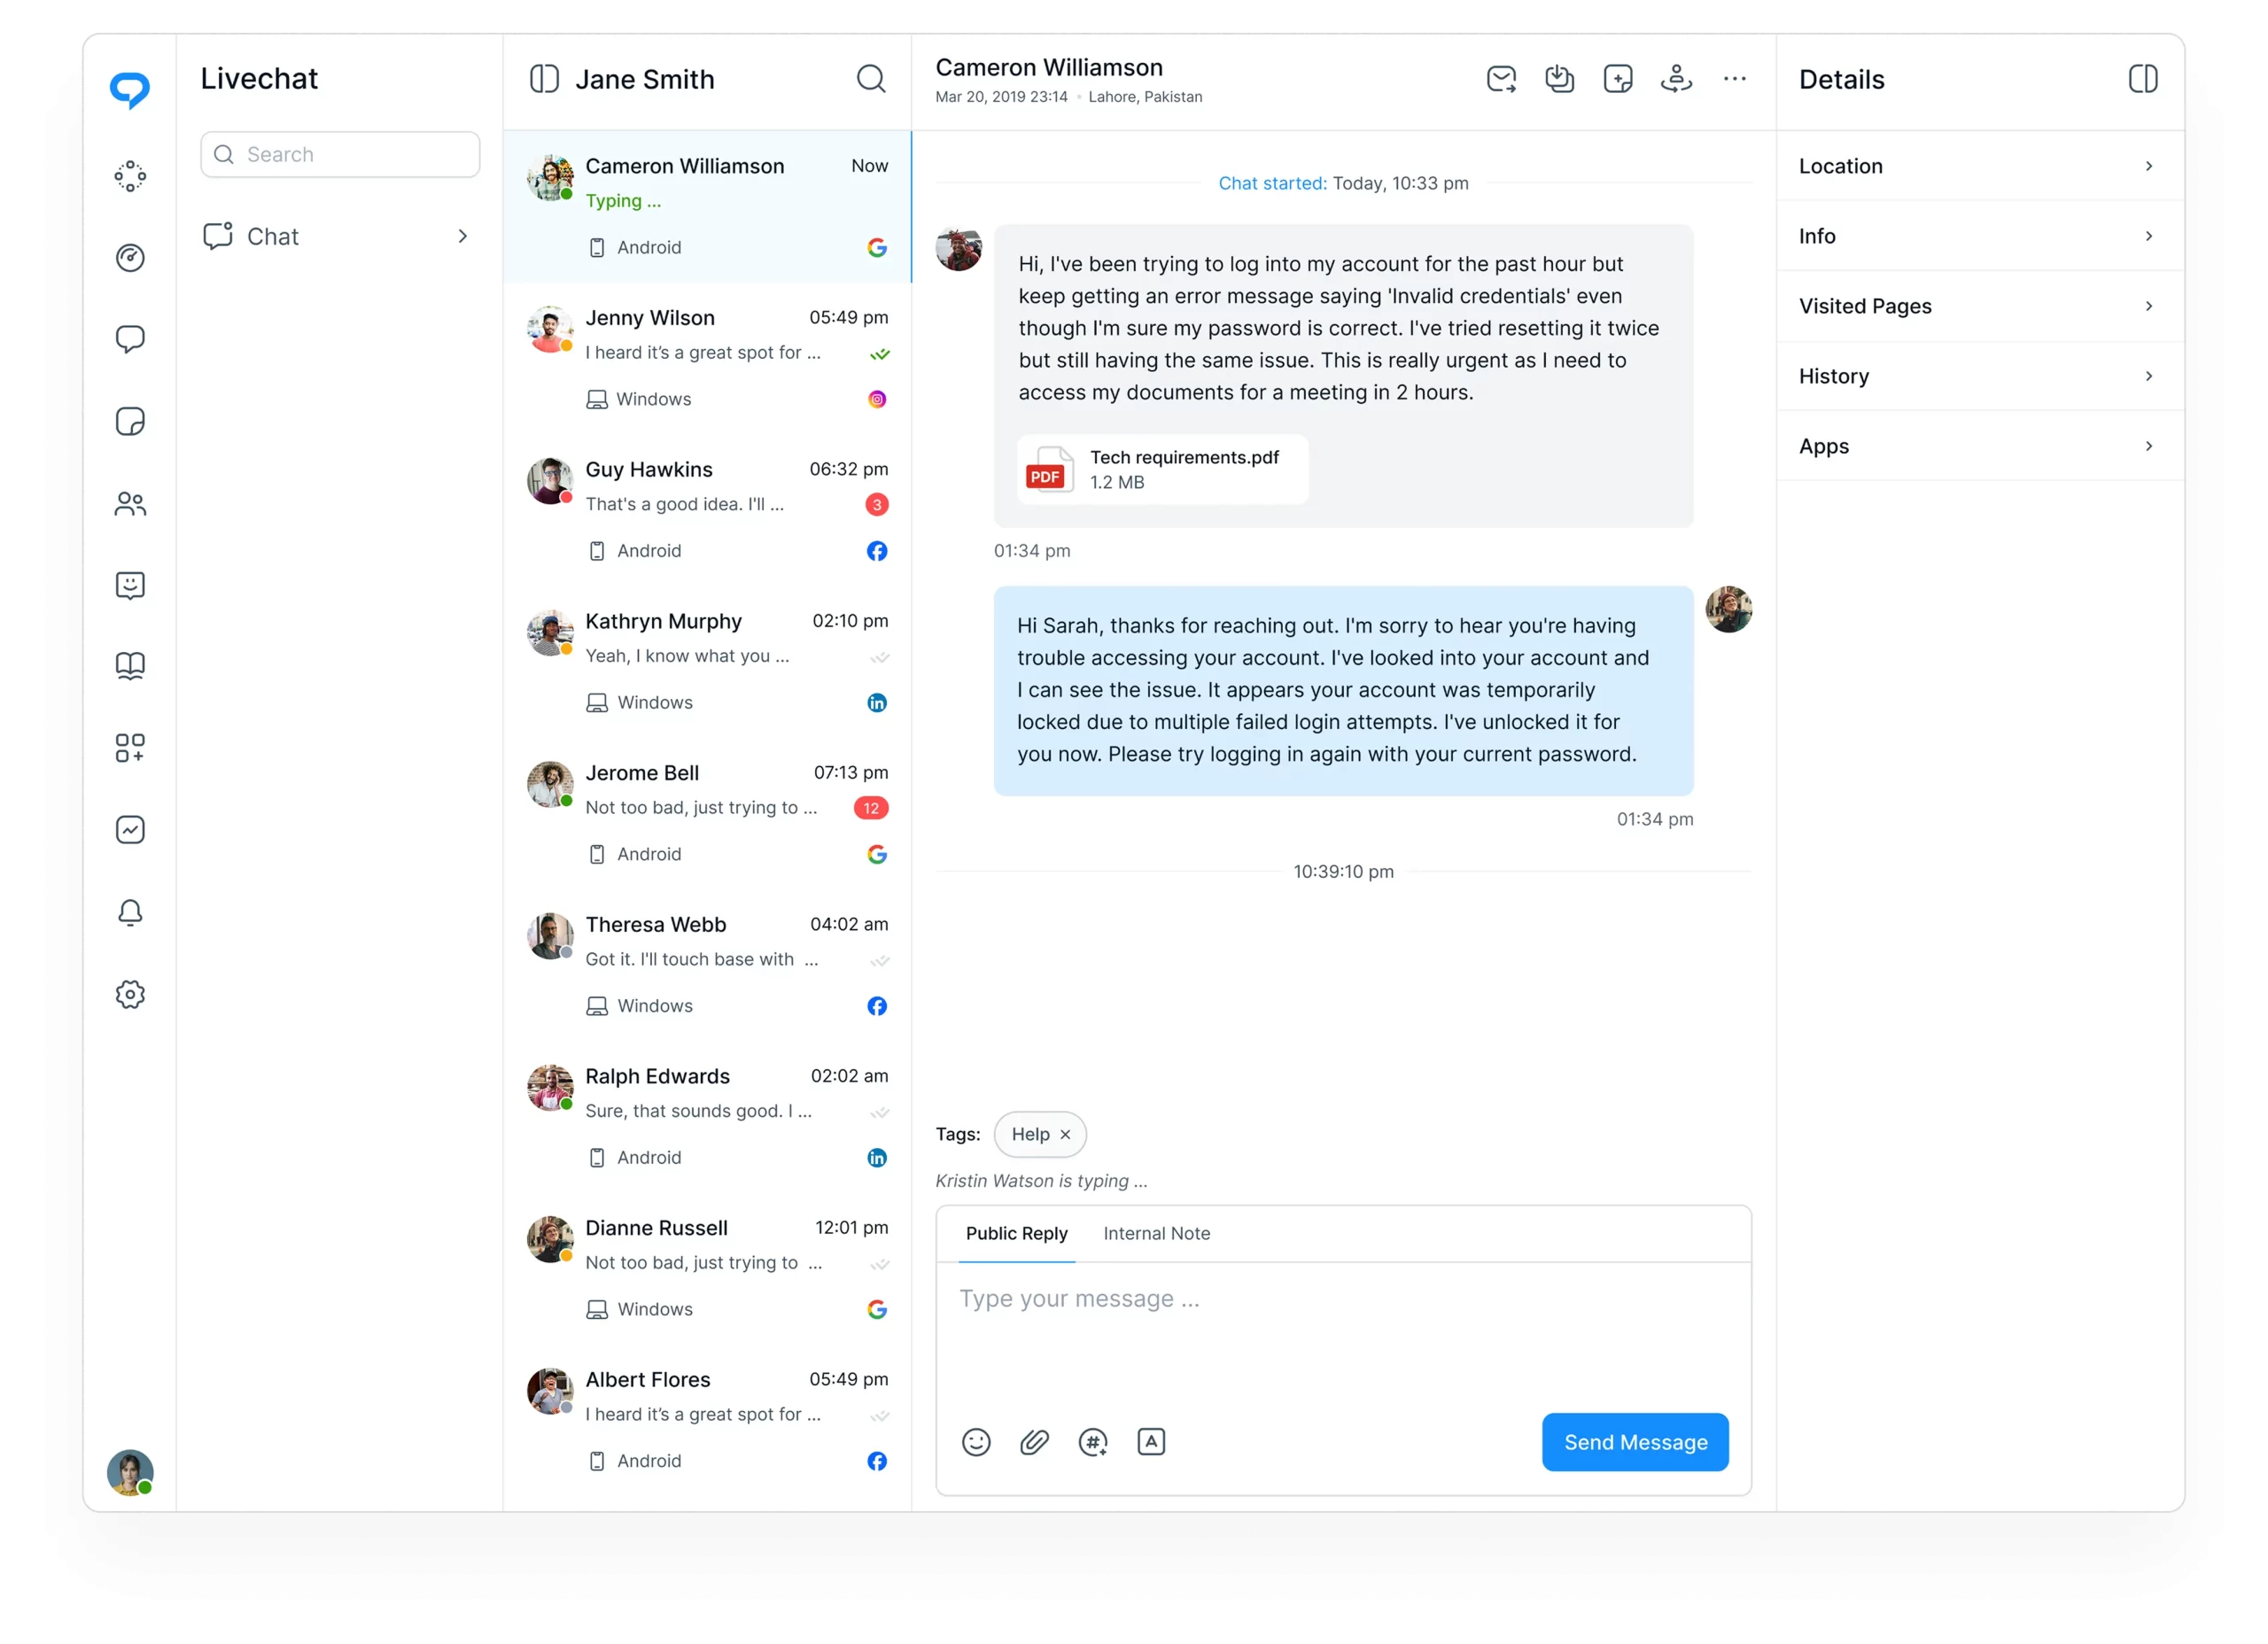
Chat‑specific metrics show how many conversations were handled or missed, how quickly responses were sent, and how long chats typically lasted.
Tag usage trends reveal which topics appear most often in conversations, making it easier to spot patterns and emerging problems.
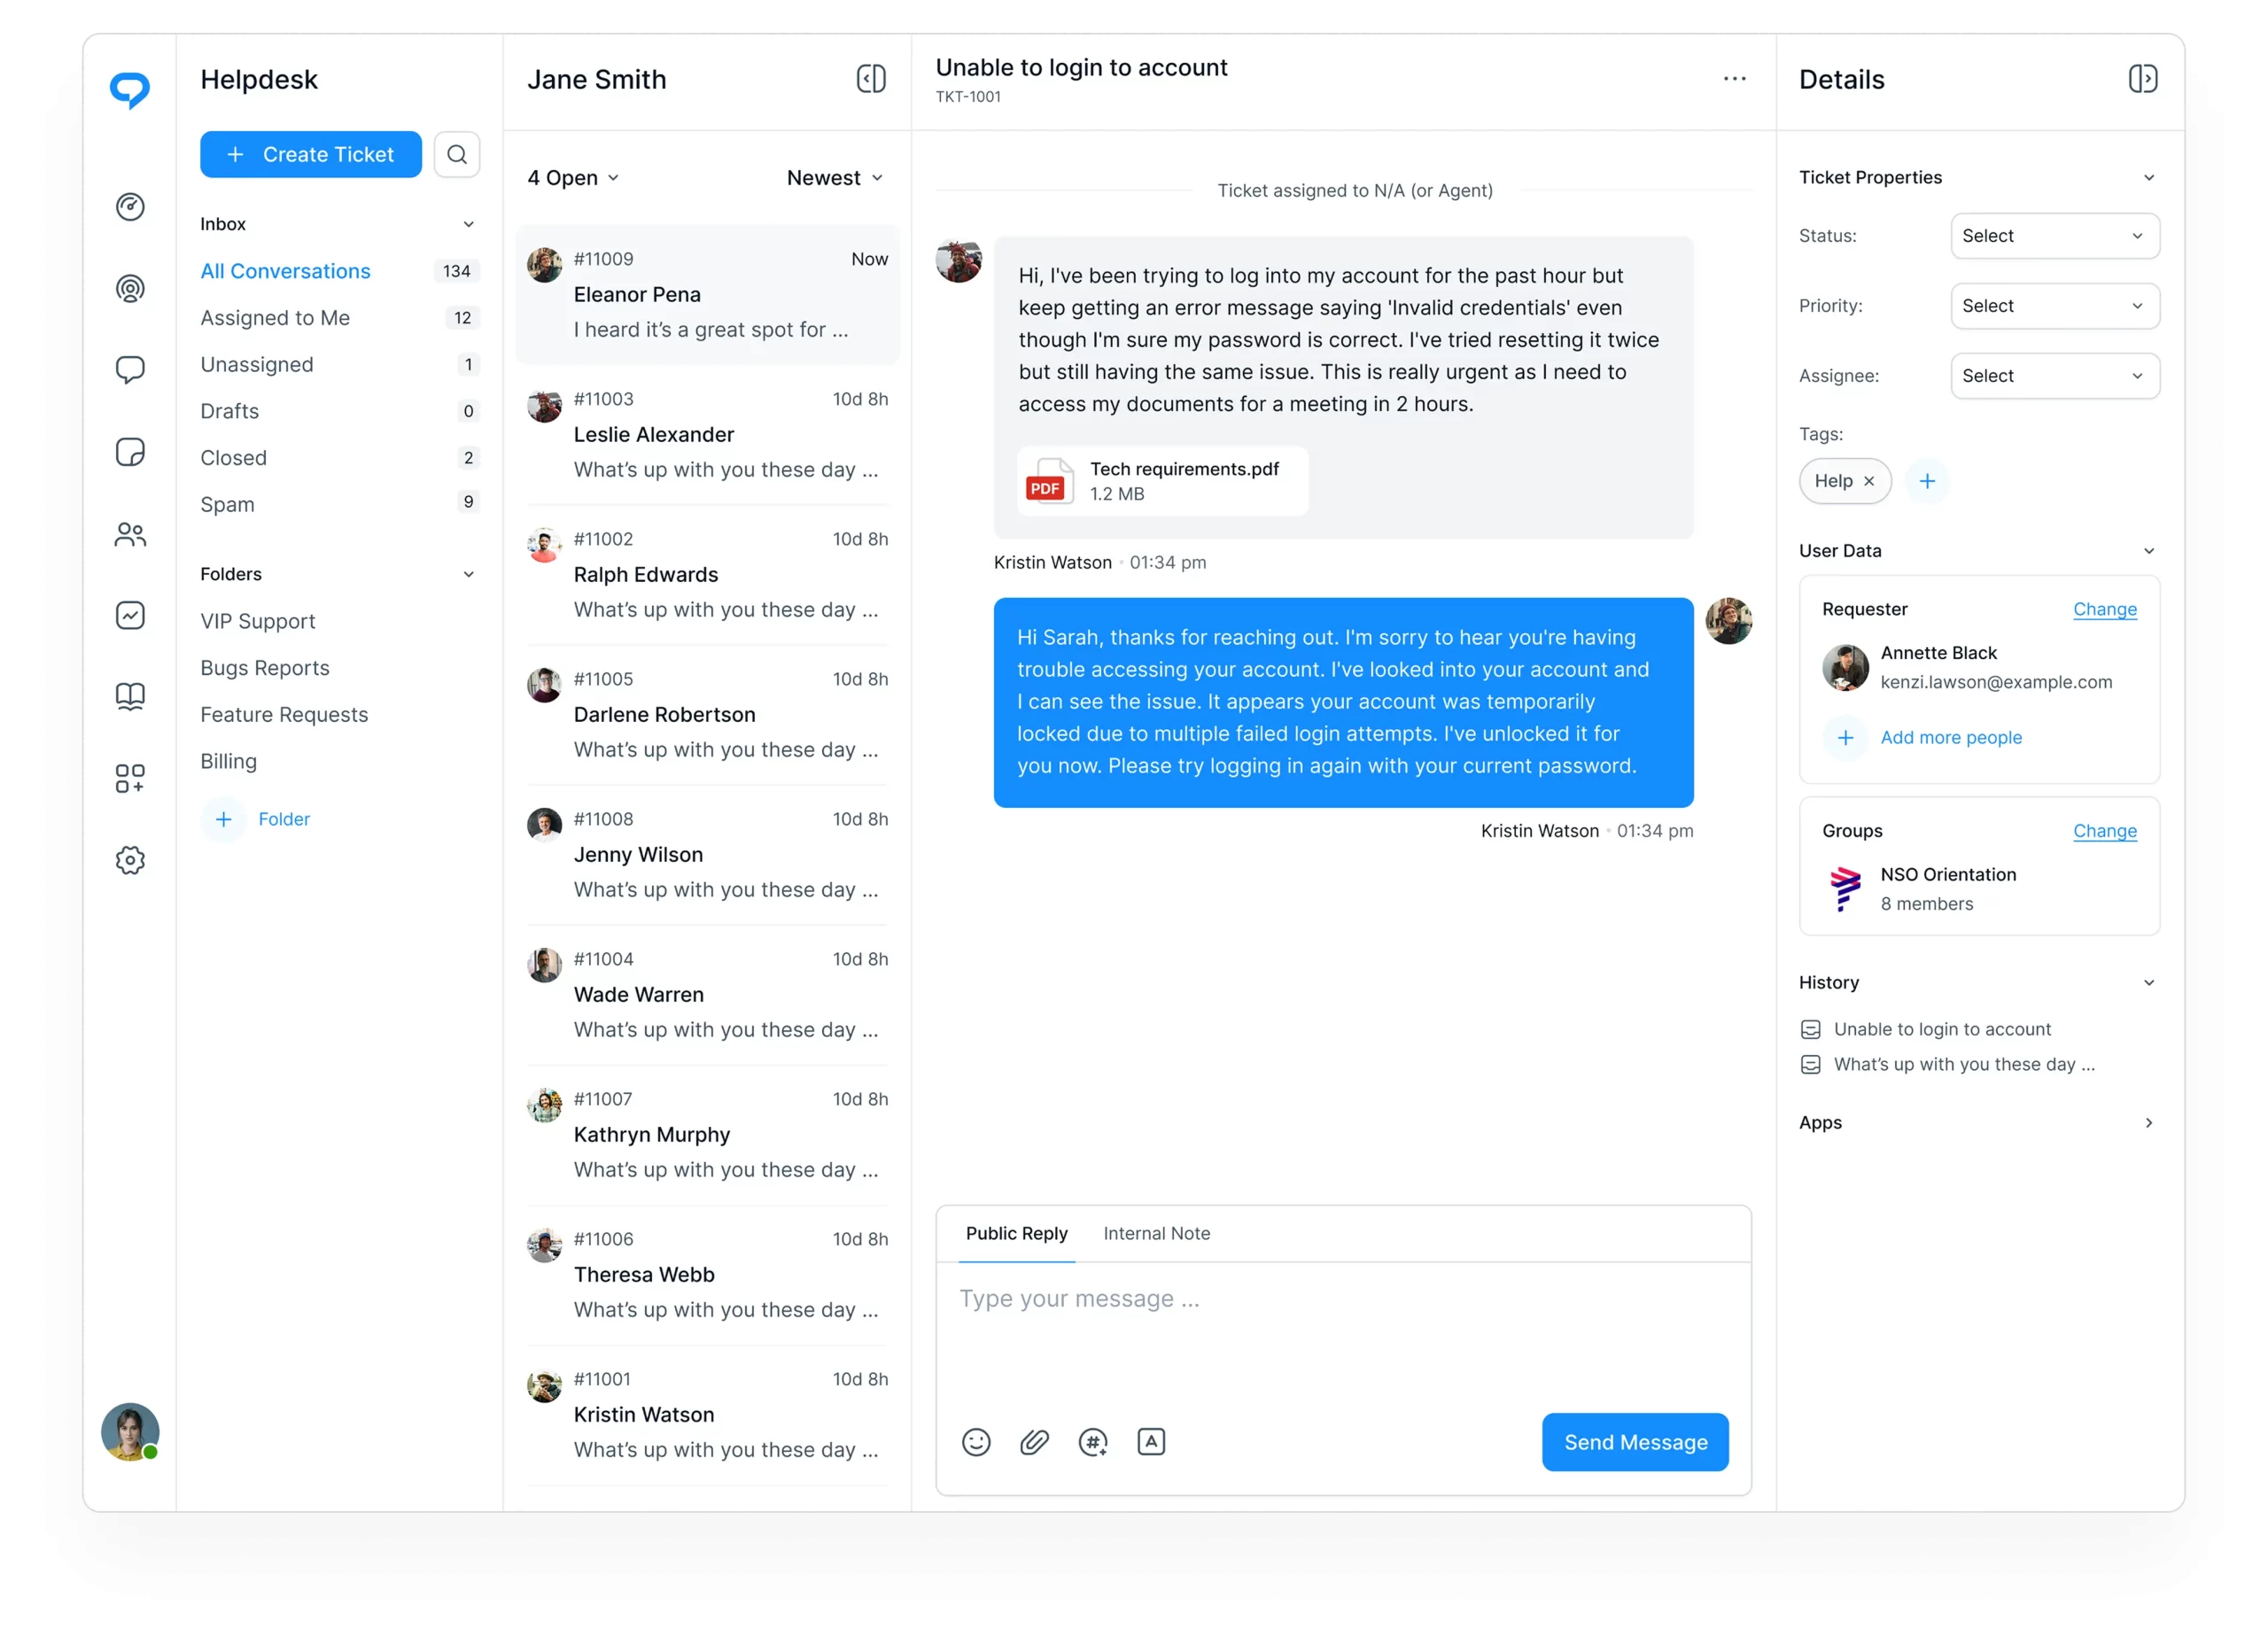
Ticket reporting shows how many issues were created, solved, or left open, along with response times and first‑reply resolution rates.
Tag analysis highlights the most frequent ticket categories, helping teams understand which problems drive the highest volume.
Agent‑level reporting shows availability, workload distribution, and contribution across chats and tickets, offering a clear view of individual productivity.
Knowledge base analytics reveal what customers search for, which articles they view most, and where content gaps may exist.
TrustChat includes reporting across live chat, tickets, agents, the knowledge base, and overall support activity, all presented in easy-to-read charts and percentages.
No. Reports & Analytics are included in every TrustChat plan.
It automatically collects data from all support channels and presents it in clean, easy-to-read dashboards.
It helps teams understand demand, improve response times, identify common issues, and make informed operational decisions.
It highlights trends in workload, efficiency, and customer satisfaction, making it easier to spot strengths and areas for improvement.
No setup is required. Reporting works automatically as your team handles chats, tickets, and knowledge base activity.
Yes. Every major reporting section includes a group selector to focus on specific brands or teams.
Yes. All reporting sections include flexible date controls, allowing you to view data for any day, week, month, or custom range.
Yes. The Agents dashboard provides detailed insights into availability, workload, and contribution for each agent.
Yes. Any report can be exported to CSV, and all exports are stored in a central repository for later download.
Customer support teams around the world rely on TrustChat to deliver lightning-fast, 24/7 help with a personal touch.